Description
This project is a focused quick reference guide to statistical programming in R. It was adapted from notes I took while learning. I learned R after completing my PhD, on my own time, for zero dollars, talking to zero humans. I benefitted from the great free resources provided by the R computing community and have condensed those references in this guide.
Six DVDs
Learning R was my first experience with open source software, and it was awesome. To understand why I thought it was awesome, it's helpful to compare it with what I was doing before.
I learned statistics with SAS ("Statistical Analysis System"). SAS is proprietary software. To use it, my university research group had to purchase a license that costed thousands of dollars per year.
To install SAS on a Mac, I had to first install Windows with the Parallels virtualization software. Next, to install SAS itself, the university's IT department provided the installer on six DVDs. They weren't in order, either. After navigating through a complicated installer interface that looked like it was designed for Windows 95, the installer would run for a few minutes, ask me to change to disc five, run for a few more minutes, ask me to change to disc 3, and so on, for hours.
What did I have to do to install R? Download it. For free. That is all.
cards;
In addition to a difficult installation process, the syntax used to write SAS programs was antiquated. Here's some code from my first statistics lab in grad school. It simply outputs some example soft drinks and their prices (note: I do not endorse the consumption of sugar-sweetened beverages).
The input code looked like this:
options ls=74 ps=100 pageno=1 nodate nocenter;
data softdrink;
input product$ color$ price;
cards;
MtDew  yellow  1.19
Crush  orange  1.1
Coke   brown   0.99
7-Up   clear   0.89
Pepsi  brown   0.9
;
proc print data=softdrink;
var price product;
run;
quit;
The output looked like this:
Obs    price    product
 1      1.19     MtDew
 2      1.10     Crush
 3      0.99     Coke
 4      0.89     7-Up
 5      0.90     Pepsi
Note the cards; line in the input code. What's up with that? It was originally a reference to punched cards. Early computer programs were just stacks of paper cards with holes punched in them. The cards were fed into the computer to run the program. Punched cards therefore acted like a primitive form of computer memory before hard drives were big enough to store data.
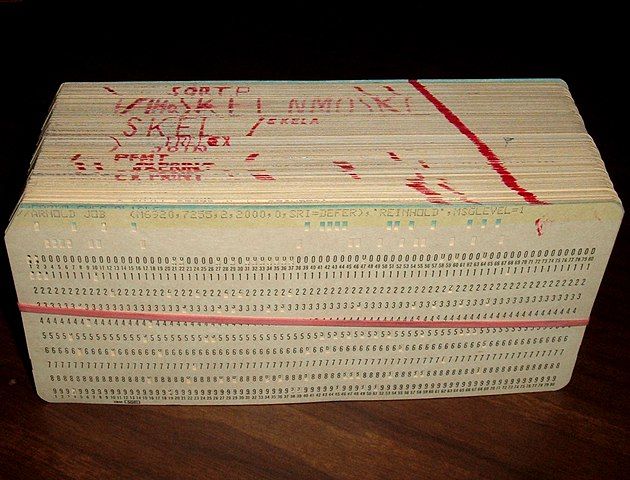
IBM 360 PL/1 punched card program, circa 1969. From Wikimedia Commons, licensed under CC BY-SA 3.0.
This was how SAS programs were originally written. There's even a related option CARDIMAGE that will tell SAS to process the data lines as if they actually were punch cards.
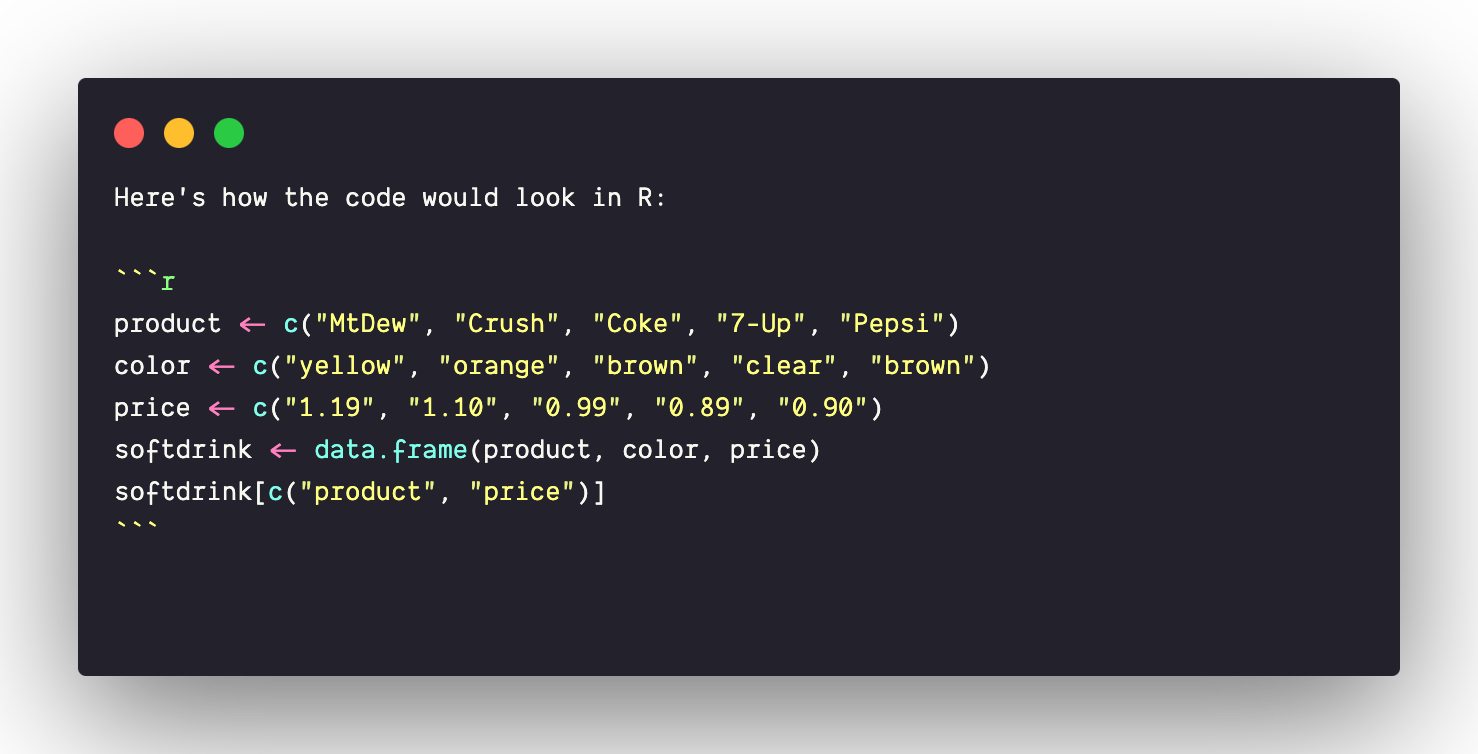
Here's how the code would look in R:
product <- c("MtDew", "Crush", "Coke", "7-Up", "Pepsi")
color <- c("yellow", "orange", "brown", "clear", "brown")
price <- c("1.19", "1.10", "0.99", "0.89", "0.90")
softdrink <- data.frame(product, color, price)
softdrink[c("product", "price")]
Computational notebooks
When I was first learning R, I took notes in a Microsoft Word document, which wasn't a very useful format. Word doesn't really have features for running (or even displaying) code, nor can it flexibly export or share the information (other than by converting the document to a PDF). I was looking for a way to make my notes more useful.
When I started learning to code, I needed a way to take notes. I started working with Markdown, a plain-text format based on HTML, the language used to structure web pages. It has most of the functionality of HTML while being simpler to read and write. For someone learning to code, mastering Markdown is a great place to start.
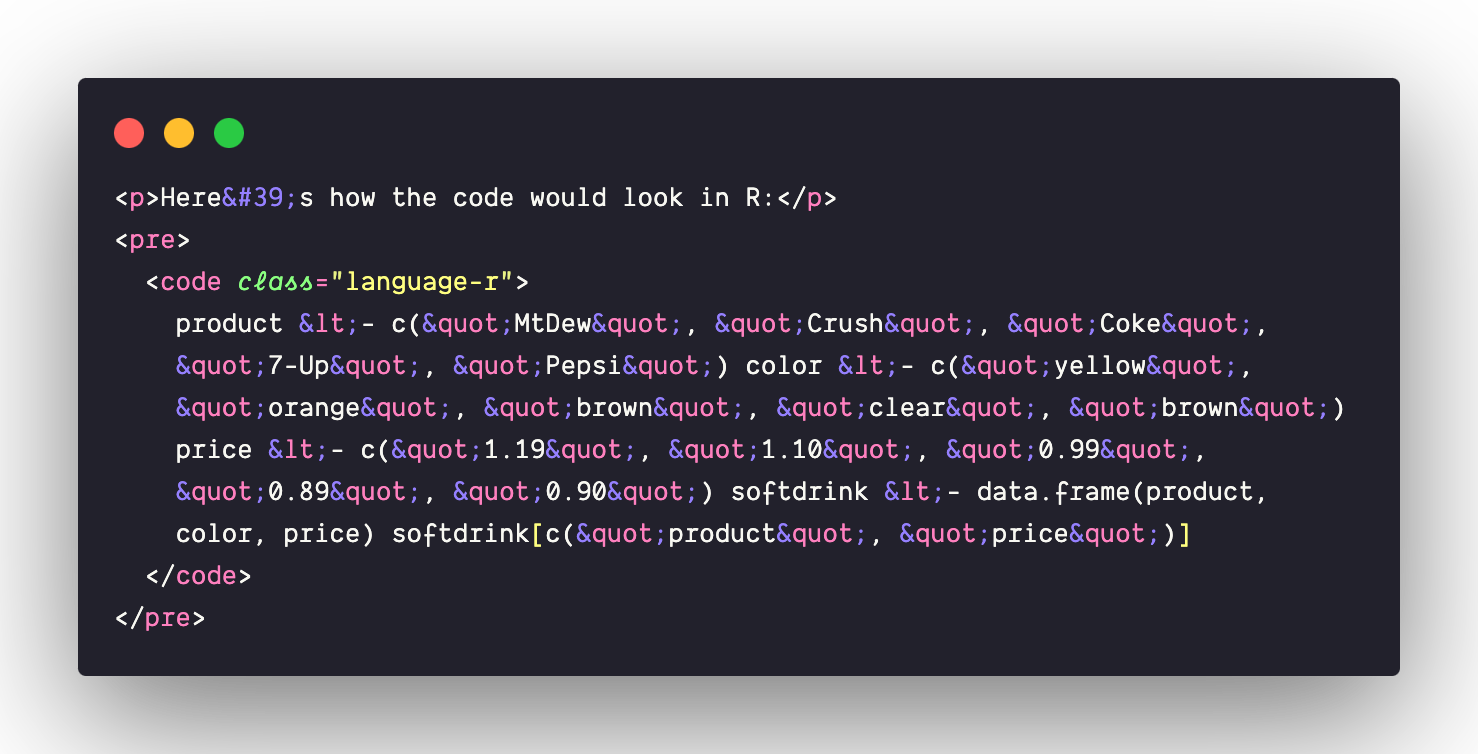
Comparison of Markdown and HTML code for the R example on this page. Which would you rather write?
Code blocks can be added to Markdown documents with triple backticks, as shown in the screenshot. But that code doesn't actually run. Wouldn't it be helpful to be able to run code from within a Markdown document? This is when I discovered computational notebooks. Computational notebook formats like R Markdown and Jupyter combine sections of Markdown text with blocks of functional code. These notebooks enable creation of computational narratives that can walk the reader through the code, while also running the code and displaying output. The computational notebook approach really made sense to me. It was like a lab notebook!
I decided to re-format my Word document with R Markdown. When I did that, I discovered another great thing about R Markdown - it could automatically output a website! That's how the R guide website is generated. It's just two R Markdown files. In fact, the page you're reading now is a Markdown file also!